
Subscribe to our newsletter!
We don't spam. You will only receive relevant and important tips for you and your business.
Unsubscribe anytime.
By Darren DeYoung
Tracking campaign performance is essential, but with so many potential metrics to review, it can be difficult to know where to begin. Some numbers offer meaningful insight into how your ads perform, while others do little to guide smart decisions. The key is focusing on a core set of metrics that highlight what’s working, what isn’t, and where your budget is most effective.

Before reviewing any data, know what your campaign is meant to achieve. Different campaigns can have different objectives: generating leads, driving online purchases, increasing app engagement, or promoting downloadable resources. Each goal aligns with specific metrics, so clarity here ensures you're measuring the right things.
These actions define what success looks like and shape which metrics deserve the most attention.
Once your goals are set, structure your campaigns in a way that allows clean analysis. Group campaigns by offer or keyword theme, and keep ad groups tightly aligned with each keyword topic. This makes it easier to understand which queries, ads, and landing pages deliver the best return.
Each ad group should point to a landing page that uses the same terminology and addresses the same intent. After launching, let the campaign run long enough to collect meaningful data. More data leads to more reliable insights.
When everything is set up properly, where do you start and which metrics should you focus on?
These metrics help you understand whether your ads are being seen and whether people are engaging with them. They reveal how effectively your ads attract users from the search results page to your site.
This metric shows how often your ad is served. High impressions can indicate broad reach, while low impressions may signal tight targeting or low ad visibility.
Impressions can give you a good idea of how your ad is performing, but as a statistic on its own, it is not very useful.

Clicks represent users who chose to visit your site after seeing your ad. A strong number of clicks signals that your messaging resonates and your targeting is appropriate.
CPC reflects what you pay each time someone clicks your ad. Competitive or high-value keywords often have higher CPCs. If a keyword is costly but generates strong conversions, the spend may be justified. If it produces little value, consider lowering bids or shifting your strategy.
CTR is the percentage of users who saw your ad and clicked. It is one of the clearest indicators of effective messaging. Higher CTR often means your copy matches user intent well. Low CTR may suggest you need stronger offers, improved relevance, or more compelling headlines.
Quality Score measures the relevance of your keywords, ads, and landing pages. Google evaluates factors such as:
A higher Quality Score can lower your CPC and improve your ad position. If your score is low, refine your keyword groupings, improve ad relevance, and strengthen landing-page content.
While traffic metrics show how many people arrive on your site, conversion metrics reveal what those users do next. These numbers help you evaluate whether your campaigns are producing meaningful actions.
Conversions can include:
If your conversion rate is low, review your landing page for clarity, ease of use, and alignment with the ad’s promise. Sometimes the issue is the offer itself, not just the page.
Phone calls often represent high-quality leads, but many businesses don’t track phone calls. With proper call tracking in place, you can attribute calls to specific keywords, ads, or campaigns. If you’re paying for clicks that result in calls, you should know exactly which campaigns drive those inquiries.
If your business relies on app engagement, track actions like installs, in-app sign-ups, or purchases. These users can be long-term customers, so capturing this data helps guide acquisition strategies.
Downloads—such as guides, case studies, or checklists—signal strong interest. If you require contact information in exchange, these conversions help grow your pipeline with engaged leads. The more valuable the material, the higher the likelihood of future sales.
Conversion rate reflects how many users completed your desired action after clicking your ad. Strong conversion rates show your offer resonates and your landing page supports it well. Low rates suggest misalignment between your ad and page, unclear value, or audience mismatch.

This measures how much you spend to generate each conversion. Efficient campaigns generate many conversions from a controlled budget. If this number rises, it could mean your audience targeting is too broad or your messaging needs refinement.
If so, this is your Cost Per Acquisition.
This metric encompasses more than just the cost of clicks a campaign receives.
Cost per conversion is great for answering, “what does it cost to get a newsletter subscriber?” But you also need to answer, “How many newsletter subscribers do I need, on average, to make a sale?” This is the Cost Per Acquisition.
Campaigns must produce customers at a cost that is sustainable relative to the revenue they bring in.
Perhaps the holy grail metric of any marketing campaign, your ROI reflects the profitability of your campaigns. The budget you devote to a paid advertising campaign needs to coincide with the financial opportunity associated with your overall goal.
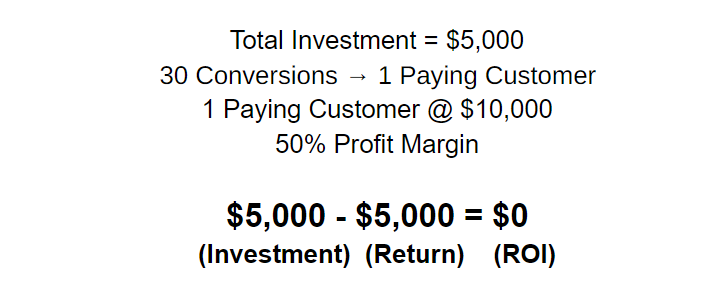
If your goal is to sell a product, you need to consider how much revenue you’ll generate from selling your product compared to the amount you’ll spend on advertising. Say you spend $5,000 and your ad campaign generates 30 conversions. From those 30 conversions, 1 becomes a paying customer. When that customer purchases your $10,000 product that has a 50% profit margin, and you break even with your ad campaign.
 To have a positive ROI, you need to increase your efficiency. This could involve converting more customers from the same audience or generating more paying customers per conversions.
Ultimately, tracking your ROI will help you objectively determine the revenue generated from your ad campaign and avoid wasting money.
Wasted spend refers to money paid for clicks that never become customers. While some level of waste is unavoidable, you can reduce it by targeting users who are most likely to convert and eliminating irrelevant searches through negative keywords. The more precise your targeting, the less you spend on unqualified traffic.
Prioritizing your paid ads metrics helps you see where your campaigns are strong, where they need improvement, and how effectively your budget is working. By organizing your goals, understanding key metrics, and watching both engagement and revenue closely, you can refine your strategy and improve overall performance.
Ready to Discuss Paid Ads?