
Subscribe to our newsletter!
We don't spam. You will only receive relevant and important tips for you and your business.
Unsubscribe anytime.
It’s no secret that having a social media presence is a necessity for any business. Social media is a highly effective tool for increasing brand awareness, establishing brand authority, and building customer loyalty through interaction and engagement.
According to Oberlo, there are 4.59 billion social media users worldwide- about 58% of the current population. According to Hootsuite, 2 out of 3 active users on Instagram say that the platform allows them to build meaningful relationships with brands.
Not only is social media a fast, inexpensive, and effective way to reach over half the world’s population, but it’s also easily trackable.
Social media metrics are a way to quantify the success of each campaign and identify insights and opportunities. When you have the right data, you can analyze the information to learn what works and what doesn’t so that you can adjust your strategy for better results.
First, you’ll need to decide what you want to accomplish with your social media presence. Do you want to sell more? Gain brand recognition? Engage and interact with consumers? Your goals should be attainable and align with your business objectives.
Understanding social media metrics can be confusing if you don’t know what you’re looking for. Ultimately, the goals you set will guide which metrics are most important to your business.
If your objective is to raise brand awareness, then metrics like impressions, volume, reach, and exposure are the most relevant.
Social listening is also a method for determining how your brand is perceived by consumers. It consists of monitoring your brand’s social media channels for customer feedback and discussions regarding specific keywords, topics, competitors, or industries in order to gauge where your brand lies in a consumer’s mind. Social listening allows for analysis to gain insights and act on those opportunities.
Tracking content metrics allows you to analyze the content you share on social media and identify specific patterns.
To track content metrics, start to document the type of content you post and how many likes, shares, and comments it receives. This will help you observe which types of content you tend to post and determine which type of posts receive the most engagement.
Perhaps you post mostly images and only a few videos, but after tracking content metrics you realize that videos receive the most engagement from users.
Audience metrics help you determine whether your target audience is engaging with your content. If your target audience is 30-40-year-old men in Minneapolis, but your Instagram following is mostly women ages 20-30 from all over the country, you have an audience alignment issue and are attracting the wrong people with your social media content.
Tracking your audience data will help you make sure you have the right followers engaging with your content.
If your goal is to drive traffic to your website, then track URL shares, clicks, and conversions.
You can also use Google Analytics to track traffic sources. This will tell you how many of your visitors are coming to your site via organic search, referrals, direct visits, or social media. If the majority of your users are arriving via organic search and a low number are from social media, this is an indicator that you may need to work on improving your social media strategy.
Measuring engagement goes beyond just tracking likes, shares, or comments. Those numbers are important and help you to see which posts perform better than others, but they don’t give insight into how users are actually interacting with your content.
Knowing what percentage of your audience finds value in the content you post can help you tailor your content moving forward.
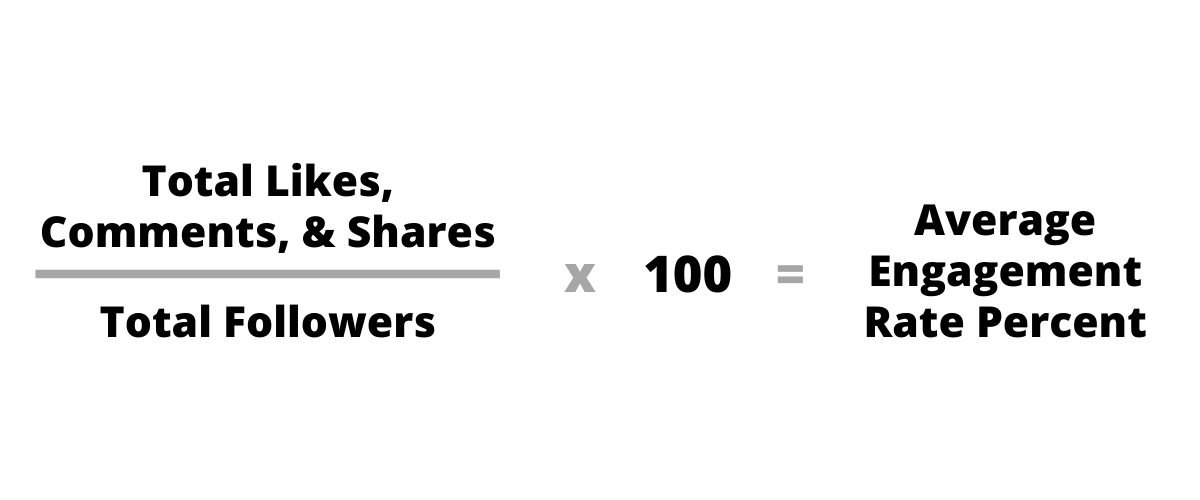
A higher engagement means that your content is resonating with your audience. If you have a high engagement rate, the actual number of likes, shares, and comments is irrelevant.
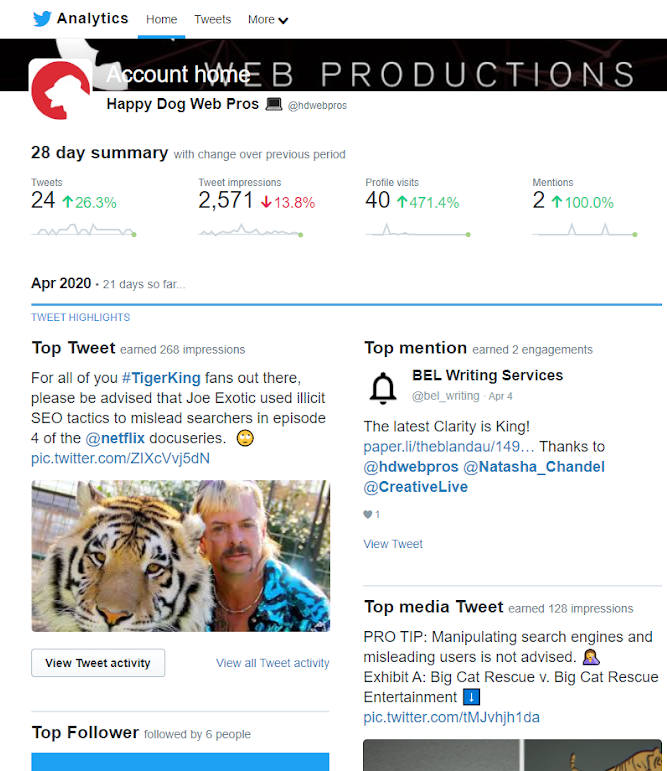
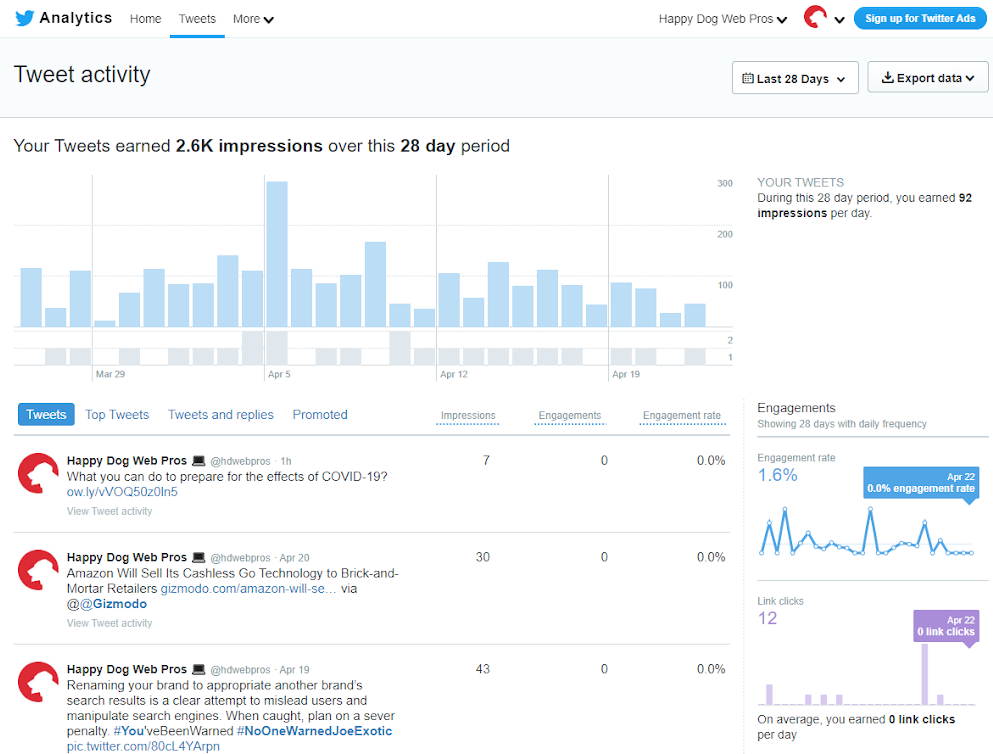
After you’ve decided which metrics are most relevant to your business objectives, you can begin to set up tracking measures. Many social platforms offer their own native analytics. Other useful tracking tools include Sprout Social and Google Analytics.
Facebook Analytics includes Facebook Page Insights & Facebook Audience Insights. Both are Facebook Analytics tools that provide valuable information that can help you track and measure your results to refine your social media strategy.
Facebook Page Insights gives you detailed analytics for your Facebook Page so that you can track what works and observe how users interact with your content.
Facebook Audience Insights helps you understand your Facebook audience so you can better target ads and create more relevant content.
You can access data going back a maximum of two years. This gives you a good set of long-term information to track your progress. It also means you’ll be able to identify any standout content that continues to spark engagement over the long term.
Instagram Insights provides data about your followers and audience, such as gender, age range, and location. You can also see which posts cultivated the most engagement and views.
The Content tab includes an overview of data for the content posted in the past seven days, including your posts, stories, and promotions.
In the Activity tab, you can track Discovery and Interactions. Discovery tracks your content’s reach and impressions, Interactions tracks profile visits or actions people take when they engage with your account.
The Audience tab gives important insights into your audience, including follower growth, top locations, age range, gender, and follower data categorized by day and hour.
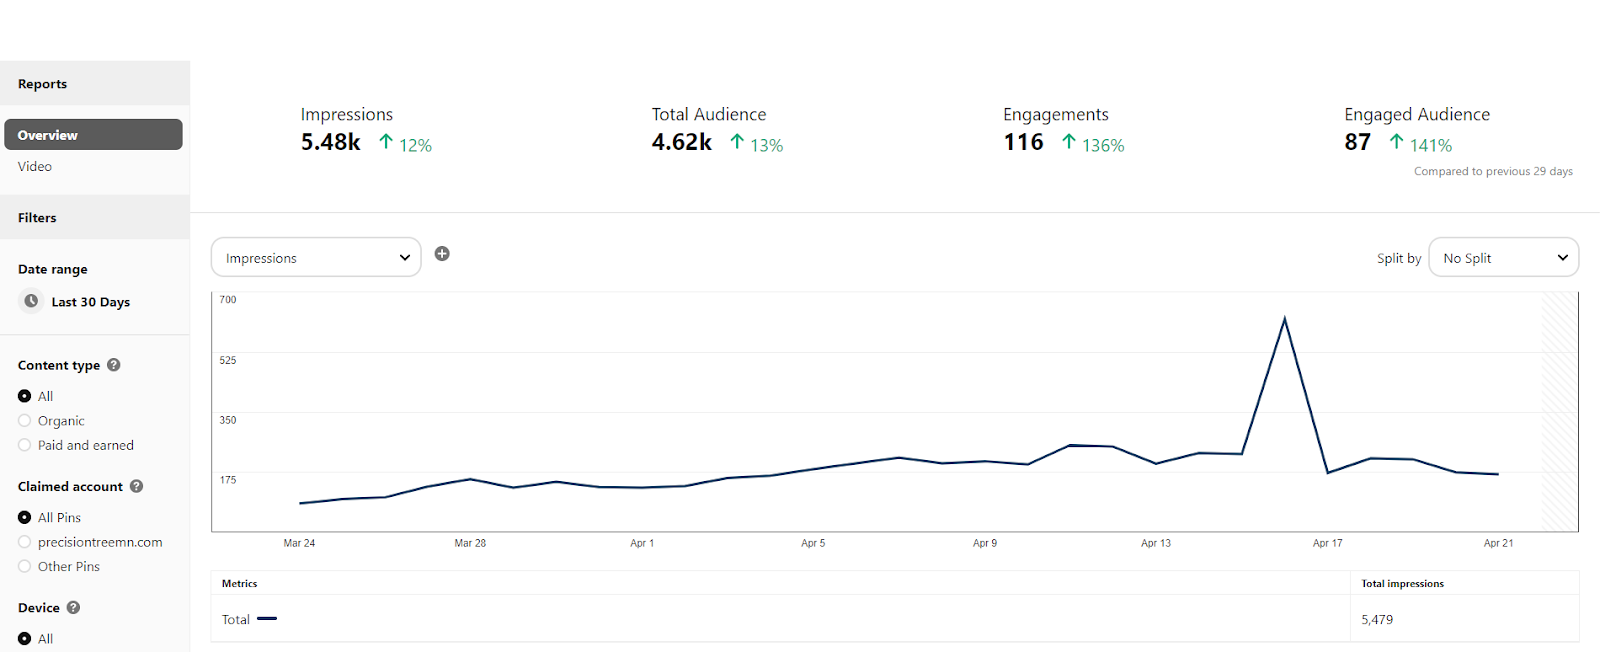
The Pinterest Analytics overview dashboard summarizes your account impressions, total audience, engagements, and engaged audience. You can also set a custom date range and look closer at impressions, engagements, closeups, link clicks, saves, and more. Within the dashboard, you can also view your top boards and pins sorted by impressions, engagements, closeups, link clicks, and saves.
Similar to the analytics home page, the video dashboard provides an account summary of video views, total watch time, link clicks, and saves as well as individual pin analytics.
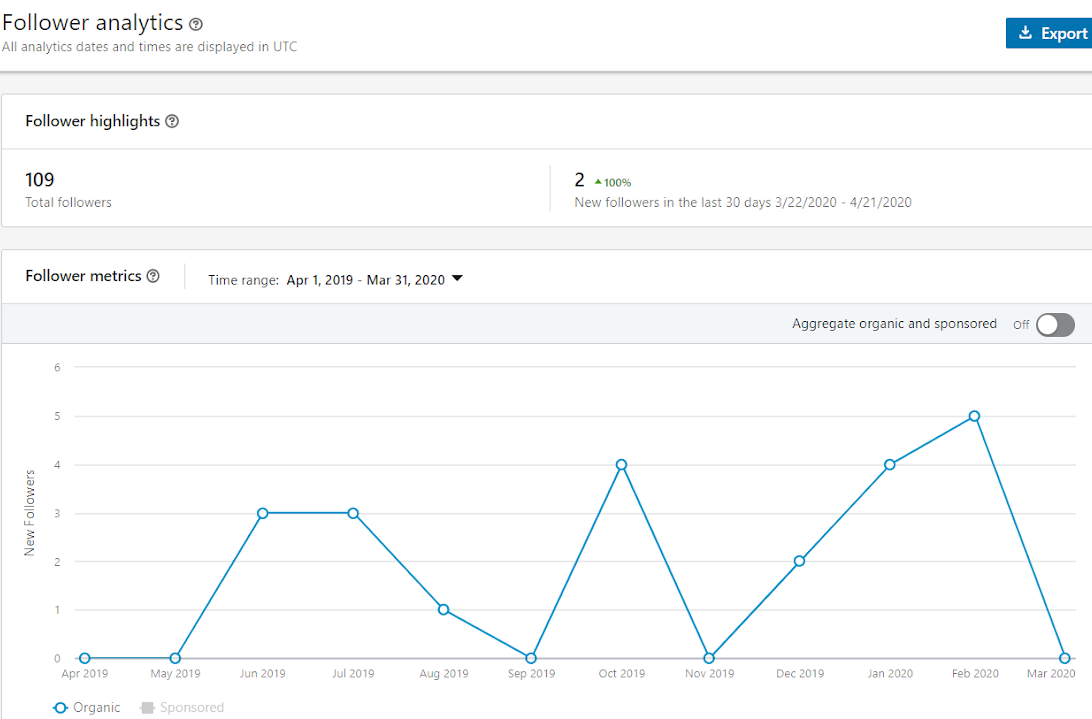
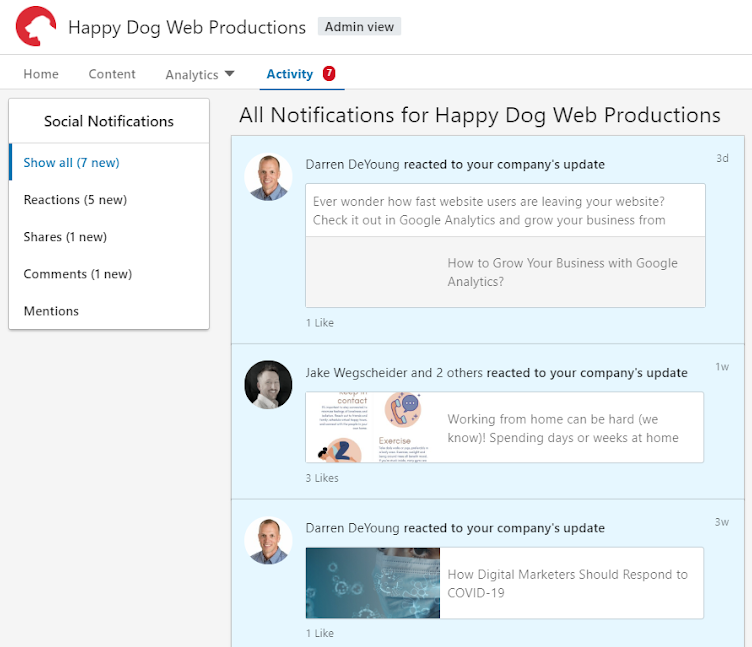
Within the LinkedIn Analytics dashboard, you can view three separate subpages: Company Page, Analytics, and Activity.
When you have real, measurable data from your social media campaigns, you can analyze it to see where you’re at in relation to your objectives. How do your numbers compare to what you expected? Did you meet your goals or is this an opportunity to make changes to your social media strategy?
Then, you can amend your social media strategy to better serve your business goals.
Do you need help making sense of your social media metrics?